Power sector in 2030
Due to the role of electrification of other sectors, a rapid decarbonisation of the power sector is essential for overall emissions reduction. According to 1.5°C compatible scenarios, emissions intensity of electricity in Poland should decrease to 60-90 gCO₂/kWh by 2030 compared to around 570 gCO₂/kWh in 2019. This decrease in emissions intensity would be driven mostly by coal phase-out by 2029 and a significant decrease in the share of natural gas, expected to be halved by 2030 compared to 2019 levels.
The government’s targeted share of coal of at least 37% in 2030 and 11% in 2040 is not compatible with 1.5°C pathways. Natural gas should be phased out no later than 2038, but the Polish government is currently heavily investing in natural gas infrastructure. These two sources of energy should be replaced by renewables, which by 2030 should generate between 76 and 86% of electricity. This is significantly above the current government’s target of 32% in the same year.2
Towards a fully decarbonised power sector
Due to the electrification of other sectors, in most scenarios electricity consumption will triple between 2019 and 2050. Following a coal phase-out in 2030 and natural gas phase-out in the late 2030s, electricity generation should become carbon neutral between 2037 and 2040 Afterwards, due to a significant contribution from BECCS, electricity generation should be the main contributor to negative emissions resulting in emissions intensity at -370 gCO₂/kWh by 2050.17
With fossil fuels almost completely phased out in 2050, almost all electricity will be coming from a mix of variable and conventional renewables, as well as BECCS. In two scenarios, fossil fuels equipped with CCS and nuclear also play a small role. Scenarios with slower phase-out of fossil fuels are characterised by a high reliance on carbon removal technologies at a later stage. These technologies are, to date, largely unproven at scale and are very expensive.
1 European Environmental Agency. Trends and projections in Europe 2020 – Tracking progress towards Europe’s climate and energy targets. (2020).
2 Ministerstwo Klimatu i Środowiska. Polityka energetyczna Polski do 2040 r. (2021).
3 European Commission. Stepping up Europe’s 2030 climate ambition. Investing in a climate-neutral future for the benefit of our people. (2020).
4 Forum Energii. Energy transition in Poland | 2022 Edition. forum-energii.eu/en/analizy/transformacja-2022 (2022).
5 Eurostat. Gross inland consumption. (2021).
6 Ancygier, A. Misfit of Interests instead of the “Goodness of Fit”? Implementation of European Directives 2001/77/EC and 2009/28/EC in Poland. (Verlag Dr. Kovac, 2013).
7 NIK. Rozwój Sektora Odnawialnych Źródeł Energii. (2017).
8 European Council. Conclusions of the European Council meeting on 12 December 2019. (2019).
9 Eurostat. Population on 1st January by age, sex and type of projection. (2021).
10 European Environment Agency. EEA greenhouse gas – data viewer. (2021).
11 ACEA. Interactive map – CO2 emissions from new passenger cars in the EU, by country. ACEA. (2021).
12 ACEA. Vehicles in use in Europe 2022. (2022).
13 Ministry of Climate. Polityka energetyczna Polski do 2040 r. (2020).
14 LULUCF sinks assumed are based on the current levels provide by the EEA: -36 MtCO₂e in 2018.10
15 While global cost-effective pathways assessed by the IPCC Special Report 1.5°C provide useful guidance for an upper-limit of emissions trajectories for developed countries, they underestimate the feasible space for such countries to reach net zero earlier. The current generation of models tend to depend strongly on land-use sinks outside of currently developed countries and include fossil fuel use well beyond the time at which these could be phased out, compared to what is understood from bottom-up approaches. The scientific teams which provide these global pathways constantly improve the technologies represented in their models – and novel CDR technologies are now being included in new studies focused on deep mitigation scenarios meeting the Paris Agreement. A wide assessment database of these new scenarios is not yet available; thus, we rely on available scenarios which focus particularly on BECCS as a net-negative emission technology. Accordingly, we do not yet consider land-sector emissions (LULUCF) and other CDR approaches which developed countries will need to implement in order to counterbalance their remaining emissions and reach net zero GHG are not considered here due to data availability.
16 Calculated based on Annex to the Poland’s Energy Policy Until 2040, table 28 and historic emissions data for 1990 from the European Environment Agency.10,13
17 In some of the analysed pathways, the power sector assumes already a certain amount of carbon dioxide removal technologies, in this case bioenergy carbon capture and storage (BECCS).
18 Ruppert Bulmer, Elizabeth; Pela, Kevwe; Eberhard-Ruiz, Andreas; Montoya, Jimena. 2021. Global Perspective on Coal Jobs and Managing Labor Transition out of Coal: Key Issues and Policy Responses. Washington, DC: World Bank. © World Bank. https://openknowledge.worldbank.org/handle/10986/37118 License: CC BY 3.0 IGO. See also Aleksander Śniegocki, Marek Wasilewski, Izabela Zygmunt, and Wesley Look. 2022. Just Transition in Poland: A Review of Public Policies to Assist the Polish Coal Communities in Transition. www.rff.org/publications/reports/just-transition-in-poland-a-review-of-public-policies-to-assist-polish-coal-communities-in-transition/
19 See e.g. European Environment Agency’s web report on Air Quality in Europe www.eea.europa.eu/publications/air-quality-in-europe-2021
Polandʼs power mix
terawatt-hour per year
- Negative emissions technologies via BECCS
- Unabated fossil
- Nuclear and/or fossil with CCS
- Renewables incl. biomass
Polandʼs power sector emissions and carbon intensity
MtCO₂/yr
- Historical emissions
- SSP1 High CDR reliance
- SSP1 Low CDR reliance
- High energy demand - Low CDR reliance
- Low energy demand
- 100%RE
1.5°C compatible power sector benchmarks
Carbon intensity, renewable generation share, and fossil fuel generation share from illustrative 1.5°C pathways for Poland
Indicator | 2019 | 2030 | 2040 | 2050 | Decarbonised power sector by |
|---|---|---|---|---|---|
Carbon intensity of power gCO₂/kWh | 570 | 60 to 90 | 0 | −370 to 0 | 2037 to 2040 |
Relative to reference year in % | −90 to −84% | −100% | −164 to −100% |
Indicator | 2019 | 2030 | 2040 | 2050 | Year of phase-out |
|---|---|---|---|---|---|
Share of unabated coal Percent | 74 | 0 to 3 | 0 | 0 | 2029 |
Share of unabated gas Percent | 9 | 5 to 8 | 0 | 0 | 2038 to 2040 |
Share of renewable energy Percent | 16 | 76 to 86 | 99 | 100 | |
Share of unabated fossil fuel Percent | 84 | 13 to 24 | 0 | 0 |
Investments
Demand shifting towards the power sector
The 1.5°C compatible pathways analysed here tend to show a strong increase in power generation and installed capacities across time. This is because end-use sectors (such as transport, buildings or industry) are increasingly electrified under 1.5°C compatible pathways, shifting energy demand to the power sector. Globally, the “high energy demand” pathway entails a particularly high degree of renewable energy-based electrification across the various sectors, and sees a considerable increase in renewable energy capacities over time. See the power section for capacities deployment under the various models.
Polandʼs renewable electricity investments
Billion USD / yr
Yearly investment requirements in renewable energy
Across the set of 1.5°C pathways that we have analysed, annual investments in renewable energy excluding BECCS increase in Poland to be on the order of USD 1.3 to 20.5 billion by 2030 and 2.1 to 23.9 billion by 2040 depending on the scenario considered. The ‘high energy demand, low CDR reliance’ pathway shows a particularly high increase in renewable capacity investments, which could be driven by an increase of electrification of end-use and modernisation of the aging electricity infrastructure, especially the grid. Other modelled pathways have relatively lower investments in renewables and rely to varying degrees on other technologies and measures such as energy efficiency and negative emissions technologies, of which the latter can require high up-front investments.
Co-benefits
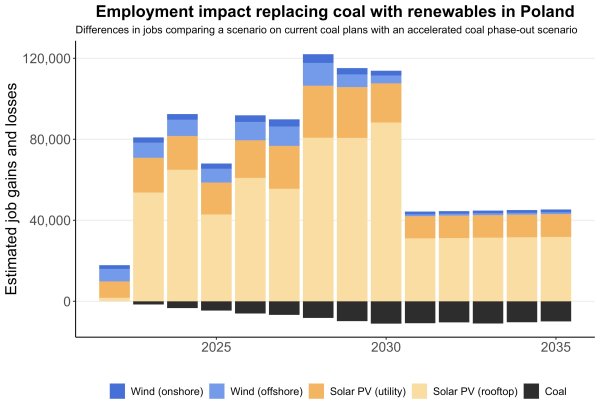
Employment impacts of replacing coal with wind and solar
Decarbonisation is linked to many other goals beyond climate change mitigation. Replacing coal power generation with renewable energy can, among other things, generate employment opportunities.
In Poland, job growth from renewables would outweigh job losses from closed coal power plants at least four to one in a scenario where coal is phased out in line with a 1.5°C pathway and replaced with solar and wind compared to following current plans for coal capacity developments.
We estimate that at least 44,000, and up to over 90,000, new jobs in renewable energy could be created from replacing the phased-out coal-fired power generation with solar and wind power generation, compared to 11,000 jobs that would be lost in coal plant operation and maintenance.
Our analysis focuses on direct jobs in manufacturing of technology parts (to the degree this happens within the country), construction and installation as well as operation and maintenance of power coal, wind and solar capacities. Other existing electricity generation technologies have not been taken into account, nor has growth in electricity demand due to increased electrification, which would increase job estimates. Additional jobs related to storage can also be expected when transitioning towards solar and wind.
Jobs in coal mining (for export or local use) are also not included in this analysis. Estimates from a World Bank report suggest that in 2019 there were around 92,600 people working in the Polish coal mining industry (incl. lignite), but coal production trends in Poland have been declining since the 1990’s and discussion on a just transition process for the sector are ongoing at the national level.18
You can find more information on the methodology and assumptions also linking to more detailed results here.
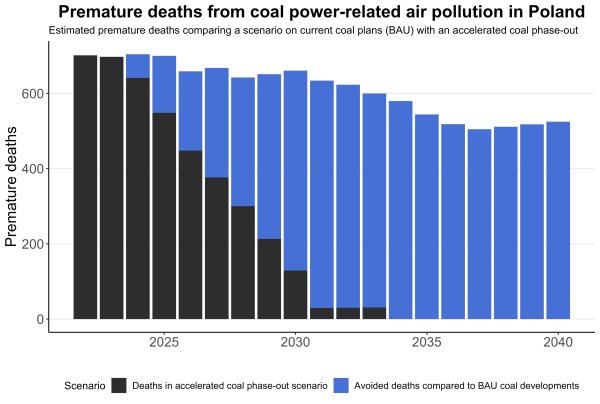
Air quality and health benefits from phasing out coal
Poland has one of the highest air pollution levels in Europe.19 While a substantial share of air pollution stems from residential heating, with coal a commonly used domestic fuel, coal-fired power generation also contributes to health-damaging outdoor air pollution levels in Poland.
An accelerated coal phase-out in Poland in line with 1.5°C could substantially reduce premature deaths from air pollution. We estimate that over 500 premature deaths could be avoided every year by the mid-2030s compared to compared to a business-as-usual (BAU) scenario illustrating current coal developments. Between 2022 and 2040, we estimate that Poland could avoid a total of close to 7500 premature deaths by accelerating its coal phase out.
Our estimates do not include deaths related to cross-border pollution, i.e. health-damages that Polish coal power plants cause for neighbouring countries. It also doesn’t include health-impacts on Polish residents caused by coal plants in neighbouring countries. If these were included, coal power-related deaths would be even higher.
You can find more information on the methodology and assumptions also linking to more detailed results here.